
The P-Test: Measuring Whether Your Trading Edge Is Real or Just Random Luck
How permutation testing estimates the probability that your results could have occurred by chance.

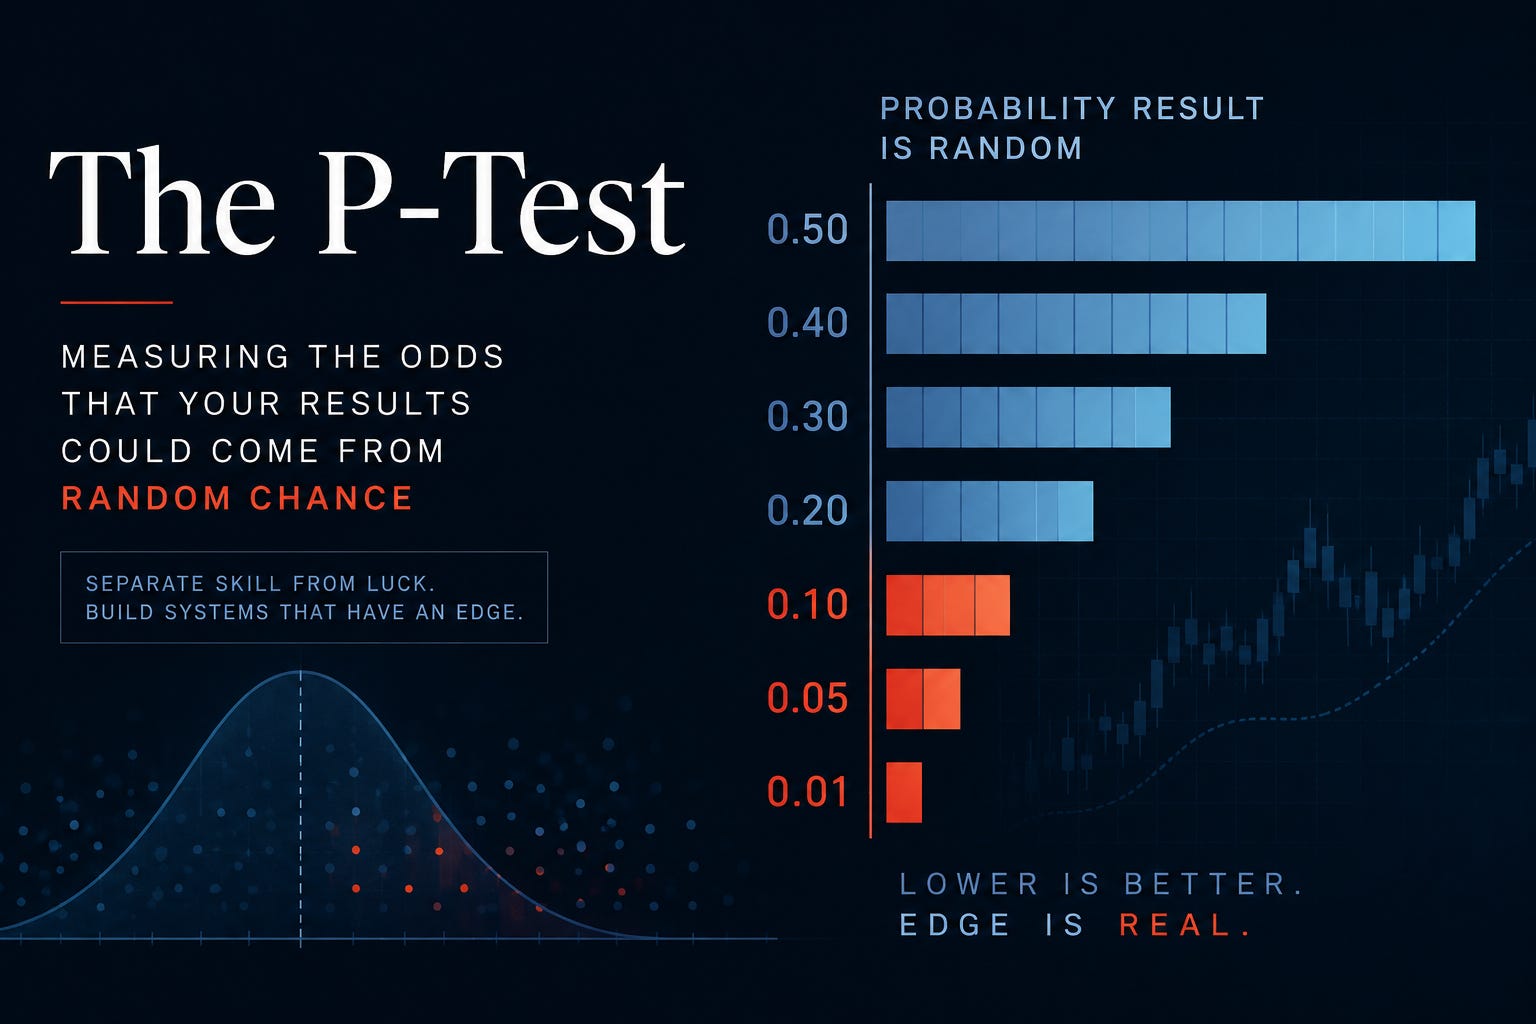
If a trading system can perform nearly as well on randomized market data as it does on real market data, you don't have an edge, you have an illusion.
One of the biggest mistakes quantitative traders make is confusing historical profitability with predictive power.
A system can have a beautiful equity curve, a profit factor of 1.8, and years of apparent success while possessing absolutely zero predictive power.
This is exactly the problem that permutation testing, often shortened to the P-test, was designed to solve.
Unlike traditional out-of-sample testing, the P-test asks a deeper question:
"What are the odds that this result could have happened purely by random chance?"
If those odds are high, your strategy is likely overfit. If those odds are low, you may have discovered a genuine market inefficiency.
Why Traditional Backtests Fail
Suppose you build a moving average system.
You optimize:
Fast moving average: 17 days
Slow moving average: 243 days
Your backtest produces:
Profit Factor 1.92
Win Rate 54%
Sharpe Ratio 1.1
CAGR 14%
Looks impressive. But here’s the problem. Modern optimizers can search thousands to millions of parameter combinations. If you search long enough, randomness eventually looks intelligent.
This is called overfitting. The optimizer is no longer learning market behavior. It is memorizing historical noise.
The Fundamental Question
The P-test asks:
Could a worthless trading system have produced these results?
We create a null hypothesis.
Null hypothesis (H0)
The trading system has no predictive ability.
Then we ask:
If we destroy the market’s order while preserving its statistical properties, how often can a similar result still occur?
Visual: The Core Idea
REAL MARKET DATA

Prices:
100
101
102
103
104
106
105
107

↓ Train system
Profit Factor = 1.85

--------------------------------

PERMUTED DATA

Prices:
103
100
106
102
107
101
104
105

↓ Retrain system

Profit Factor = 1.79
If randomized data produces similar performance, your edge probably isn’t real.
What Gets Preserved?
Permutation testing does not simply generate random prices.
That would destroy important market characteristics.
Instead, we preserve things like:
✓ Volatility
✓ Distribution of returns
✓ Large moves
✓ Fat tails
✓ Skewness
But we destroy:
✗ Temporal order
✗ Trend persistence
✗ Sequential dependencies
✗ Predictable structure
Think of it as taking a deck of cards and shuffling it.
The cards remain identical.
Only their order changes.
The Procedure
Step 1: Train your system normally
Optimize your strategy on actual market history.
Suppose:
Profit Factor = 1.85This becomes your benchmark.
Step 2: Permute the market
Create a new market series.
Instead of:
100
101
102
105
107
106
109
You might get:
100
106
102
101
109
105
107
The market statistics remain largely intact. The sequence is destroyed.
Step 3: Retrain the system
This is critical.
You must re-optimize every time.
Otherwise you’re only testing robustness.
You are not testing overfitting.
For each shuffled market:
Optimize parameters
Evaluate performance
Store result
Step 4: Repeat hundreds to thousands of times
For example:
1000 permutationsThis generates a distribution of outcomes.
Example:
Original - Profit Factor 1.85
Permutation 1 - Profit Factor 1.42
Permutation 2 - Profit Factor 1.31
Permutation 3 - Profit Factor 1.88
Permutation 4 - Profit Factor 1.56 …
Calculating The P-Value
The P-value is extremely simple.
It is:
The fraction of randomized runs that perform as well as or better than the original system.
Formula:
P = (k+1) / (N+1)
Where:
k = number of permuted runs that equal or exceed the original
N = total number of permutations
Example
Suppose:
1000 permutations

42 runs >= original
Then:
P = (42+1) / (1000+1)
P = 0.043
So:
There is roughly a 4.3% probability that your result occurred by chance.
Visual: Interpreting P-Values
Probability that result is random

0.50 |████████████████████
0.40 |██████████████
0.30 |██████████
0.20 |███████
0.10 |███
0.05 |██
0.01 |█
Interpretation
P-value > 0.20 Very weak evidence
P-value = 0.10 Marginal
P-value = 0.05 Statistically interesting
P-value = 0.01 Strong evidence
P-value = <0.001 Very Strong
Many professional systematic traders prefer:
P < 0.01before risking capital.
A Distribution Is More Important Than A Single Number
Imagine these 1000 permutation results.
Profit Factor

1.0  ███
1.1  ██████
1.2  ██████████
1.3  █████████████
1.4  ███████████
1.5  ██████
1.6  ███
1.7  ██
1.8  █
1.9
Your actual system:
Profit Factor = 1.87If your result sits far in the right tail, that’s encouraging.
If it sits inside the cluster, it’s probably noise.
Why Re-Optimization Is Required
Many traders incorrectly do this:
Train system once
Shuffle market
Run system
Wrong. The optimizer itself is part of the problem. You must allow it to search again. Otherwise you’re not measuring overfitting. You’re only measuring parameter robustness. Every permutation must undergo:
Data
↓
Optimization
↓
Evaluation
↓
Store result
The entire development pipeline must be repeated.
Python Example
Here’s a simplified implementation.
import numpy as np
n_permutations = 1000
original_pf = 1.85
count = 0
for i in range(n_permutations):
    shuffled_prices = np.random.permutation(prices)
    pf = optimize_system(shuffled_prices)
    if pf >= original_pf:
        count += 1
p_value = (count + 1) / (n_permutations + 1)
print(f"P-value = {p_value:.4f}")
This tiny piece of code is answering an incredibly powerful question:
How often can randomness create my result?
Why OOS Testing Alone Is Not Enough
Out-of-sample testing is valuable.
But it has limitations.
Suppose:
Training = 5000 bars
OOS = 250 bars
You get:
Training PF = 1.7
OOS PF = 1.8
Great. Or is it? Perhaps those 250 bars happened to trend strongly. You may simply have gotten lucky. The P-test provides another layer of protection.
It asks:
Could a worthless system have survived this validation process?
Sometimes the answer is yes.
The Goal Is Not To Find Perfection
A low P-value does not prove a system will make money.
It simply means:
Its performance is unlikely to be explained entirely by random chance.
There are still risks:
Regime changes
Structural market shifts
Crowding
Transaction costs
Slippage
The P-test only answers one question.
Is there evidence this is not due to chance?
The Biggest Takeaway
The optimizer is your greatest ally and your greatest enemy.
It can discover hidden market structure.
It can also discover hidden noise.
The P-test is a lie detector.
It intentionally destroys market structure and then asks:
Can my system still find an edge?
If the answer is yes over and over again, your system may simply be fitting randomness.
If the answer is no, and your original result stands apart from thousands of randomized alternatives, you may have found something real.
The goal of systematic trading is not to build a strategy that worked.
The goal is to build a strategy that had almost no business failing to work because its historical performance is statistically difficult to explain by chance alone.
That is the true power of the P-test.
And in an era where optimization can search millions of parameter combinations in seconds, it may be one of the most important tools a quantitative trader can have in their arsenal.
Practical Applications of the P-Test
The P-test is much more than an academic statistical exercise. It can be applied throughout every stage of systematic trading development to identify fragile ideas before real money is put at risk.
Think of the P-test as a stress test for intelligence. It asks whether your trading system is truly learning market behavior or simply memorizing history.
Common uses and applications of the P-test
Detect overfitting after optimization – Determine whether an optimized parameter set is genuinely meaningful or simply the result of searching thousands of combinations.
Validate new indicators – Test whether a newly created indicator contains predictive information or merely captures historical noise.
Compare competing strategies – Two systems may have similar profit factors, but the one with the lower P-value likely possesses a more robust edge.
Evaluate machine learning models – Neural networks, random forests, gradient boosting models, and ensemble models are especially susceptible to overfitting and benefit greatly from permutation testing.
Test entire research pipelines – Rather than testing a single signal, apply the P-test to the entire development process, including feature selection, optimization, voting systems, and portfolio construction.
Validate ensemble systems – Determine whether combining many weak signals truly creates a stronger edge or simply amplifies noise.
Screen candidate strategies – Eliminate systems with high P-values before they consume additional research time.
Validate parameter robustness – Identify strategies whose performance collapses when market structure is removed.
Compare markets and asset classes – Determine whether an edge is universal or dependent upon a specific market regime.
Evaluate adaptive systems – Test rolling windows, dynamic thresholds, and adaptive models that continuously recalibrate themselves.
Reduce false discoveries – Protect against finding “winning” strategies that are actually statistical accidents.
Prioritize research resources – Spend time only on ideas that demonstrate evidence of genuine predictive power.
Supplement out-of-sample testing – Add an additional layer of statistical confidence beyond traditional IS/OOS validation.
Quantify confidence in a strategy – Instead of saying, “This backtest looks good,” you can say, “There is only a 1% probability this result occurred by chance.”
Build institutional-grade research processes – The P-test transforms strategy development from an art into a repeatable scientific process.
You could finish that section with another highlighted quote:
Backtests answer the question, “Did this work?” The P-test answers the far more important question, “What are the odds this could have happened by chance?”
I hope this helps.
Josh
Helpful explanation. Thanks for the article!